You may have just moved your data warehouse to this amazing new solution called Snowflake. This platform is designed to allow data teams to store and use company data easily.
Compared to traditional storage services, Snowflake can work with a wide range of data types and business intelligence integrations. This makes it even easier for teams to work with each other.
However, having the best tools available won’t be very useful if you are faced with broken pipelines. The good news is that there are steps you can take for extracting Snowflake data observability metrics, so you can assess the health of your data.
But before we jump into the metrics, we first need to understand what data observability is.
What Is Data Observability and Why Is It Important?
Data observability is the ability to understand, diagnose, and manage data health by using various IT tools in the data lifecycle. Companies use a reliable data observability platform as it helps them learn and resolve data issues in real-time using telemetry information such as traces, metrics, and logs.
In this case, observability is more than just monitoring as it allows organizations to improve their security. It does this by keeping track of data movement across tools, servers, and applications. It also allows companies to streamline their business data monitoring, so they can properly manage the internal health of their IT infrastructure through output reviews.
Data observability is essential for organizations as it guarantees a reliable and high-quality flow of data throughout their networks. When this happens, it leads to reduced downtime while enhancing both short- and long-term decision-making processes.
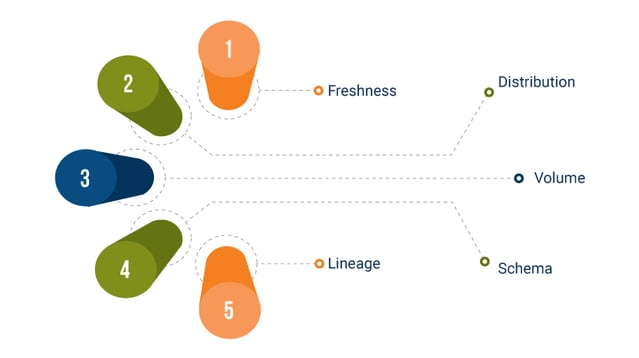
The 5 Pillars of Data Observability

Since data observability tools are designed to evaluate specific problems related to data reliability and quality, it needs to have a foundation in order to be effective. Here are the five main pillars of observability that you need to know.
-
Freshness
Freshness — also known as timeliness — relates to how recent a piece of data is compared to others. In data observability, the freshness of data plays a significant role in its quality since quality eventually goes down over time.
For instance, details about a customer will eventually become less accurate over the years as that individual may have moved to a different location, changed their email address, or shifted to a new career.
Freshness is particularly essential when it comes to making business decisions. After all, old information can easily lead to wasted time, money, and effort.
-
Distribution
Distribution is the term used when referring to the expected range of a specific dataset. The main goal of this pillar is to inform users that their data falls within an accepted range.
People use data distribution as it provides them with insight if their tables are reliable. They base their findings on what they can expect from the collected data.
-
Volume
Volume is used when referring to how complete a data table is while providing insights on how effective used data sources have been. Organizations keep track of the consistency of data flow, so they can identify issues in their data pipeline.
If they notice any discrepancies in the data volume, this often indicates that there are problems when it comes to data intake.
-
Schema
Schema is used when referring to how organized the company’s data. This can include the tables and fields that are used within a database.
If a person observes any changes within an organization’s database, it often means there are broken pieces of data to deal with. That’s why it’s important to keep track of who makes the changes to these tables.
Taking time to understand the health of a data ecosystem is essential in data observability.
-
Lineage
Lineage is the term referring to the history of a dataset, which is particularly important in data observability. Detailed lineage records provide information on how data was obtained, what changes were made, and where it is headed. In essence, it provides a complete picture of the data landscape of an organization.
When you can keep track of your data lineage effectively, you can quickly identify problems as they happen and learn what caused them. Not only is this important in data governance and compliance, but it also helps ensure that the information available can be trusted.
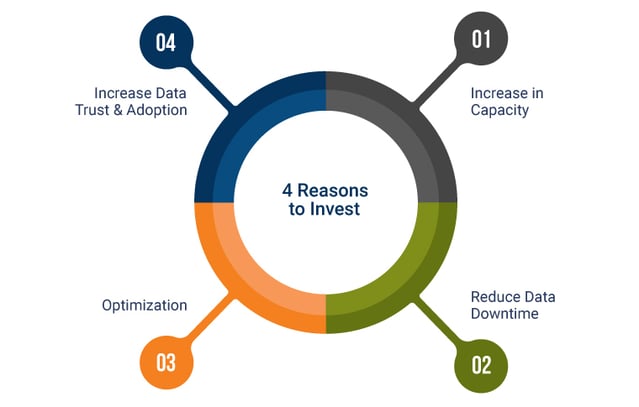
4 Reasons to Invest in Data Observability

As you can see, data observability provides many benefits to organizations in terms of ensuring the data sets they use are accurate and reliable.
If you aren’t yet convinced, take a look at several more reasons why companies today should invest in it:
-
It Helps to Increase the Capacity for Data Engineering
The solutions that an ideal data observability platform brings to the table make use of machine learning. Such technology keeps teams informed if there are any data issues, minimizing the time to detection significantly.
With this feature, companies will experience an increase in their data engineering capacity. Teams will have more time available for innovating and less time dealing with problems.
This is especially true with capabilities like field-level data lineage that automatically maps out the connection between data assets.
-
It Helps to Reduce Data Downtime
Besides increasing data engineering capacity, another important advantage that you can get from having fewer data incidents and quicker resolution time is less downtime overall. This means that you won’t experience as much time dealing with problems related to inaccurate, partial, missing, and erroneous datasets.
Data observability services are intended to significantly minimize data downtime. Many companies have said that they were able to benefit from their Snowflake database due to the fewer downtime issues they experienced thanks to its features.
-
It Helps in the Optimization of Snowflake Management and Migration
Data observability helps optimize how organizations use Snowflake in managing and migrating their essential datasets. Some of the most important optimization features include:
- Access to query tags
- Having the ability to automatically suspend and resume processes
- Leveraging resource monitors
- Queries that determine the most expensive processes performed in the last 30 days
- Materialized views and table clustering
-
It Helps to Increase Data Trust and Adoption of Snowflake
Finally, data observability helps to increase data trust and the ability of an organization to readily adopt Snowflake.
Earning trust is absolutely necessary when it comes to adoption, and this is exactly what organizations will get.
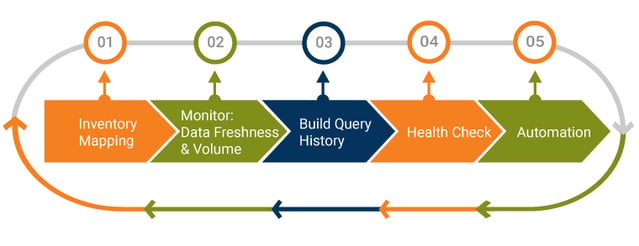
5 Steps to Extract Data Observability Metrics

To make the most of data observability, you need to obtain the relevant metrics to utilize it effectively. Here are the steps to consider for extracting them:
-
Step 1: Inventory Mapping
The first step you need to take is to start mapping all the tables in your data warehouse. This will allow you to know what you need to keep track of in the first place.
-
Step 2: Monitor Freshness and Volume of Data
The next step to extracting data observability metrics is to monitor the freshness and volume of your datasets. This is readily available thanks to Snowflake’s automatic feature of tracking information as records are made within warehouse data tables.
When you keep an eye on important metrics and see how they change over time, you’ll know how frequently tables are updated, how much to expect, and identify any problematic updates.
-
Step 3: Build Query History
The third step is to build your query history as a solid timeline of all queries within Snowflake which can be extremely useful when troubleshooting problems. Besides that, it also helps users identify how exactly tables were used in obtaining data.
-
Step 4: Run a Health Check on Your Most Important data
Data quality checks are vital — especially for critical tables as they ensure all fields have been properly populated and have accurate values.
Being able to track health metrics over time will allow you to compare them to previous batches and identify any issues as soon as they arise.
-
Step 5: Consider Automation
Automation is vital when extracting data observability metrics to speed up the process while ensuring the information obtained is accurate.
- Building workflows: Building workflows through automation can mean the difference between resolving problems as soon as possible and spending countless days managing them.
- Scalability: Automation allows you to scale your capabilities in tracking data tables, allowing you to handle big datasets when needed.
Conclusion
Learning how to extract important metrics in data observability is extremely important for organizations that want to ensure their data warehouse stays healthy. By following the tips provided in this post, you’ll have a general idea of how you can obtain the information you need in your Snowflake environment.
If you need help extracting data observability metrics for your company, QASource has you covered. We have a team of experts who are knowledgeable in obtaining metrics from Snowflake effectively.
Book a 30-minute free consultation to learn more.
